periodic table app flask python 22 January 2017
mendeleev web app
The first working version of the mendeleev app
In Short:
mendeleev app is a web app that allows interactive explorations of the periodic table and relationships between various properties of the elements and generation of aesthetic images and scatter plots.
Since I first discovered bokeh I instantly adopted it to my work flow. Currently I use it mainly for visualizing intermediate results in Jupyter notebooks when doing data explorations or code experiments. The interactive tools it offers are extremely helpful especially with larger sets of data and ones containing outliers where visual inspection can speed up the whole analysis.
While reading various bits of bokeh documentation I discovered that bokeh offers a lot more that just Jupyter support but actually provides excellent tools for creating interactive visualizations for for the web including plots, widgets etc.
At that time I was already working on my mendeleev python package which collects considerable amounts of data on elements from reliable source and wraps it in a convenient python API. Therefore when I saw one of the examples from the bokeh gallery that used the library to display the periodic table I started thinking about a web app.
Periodic Table
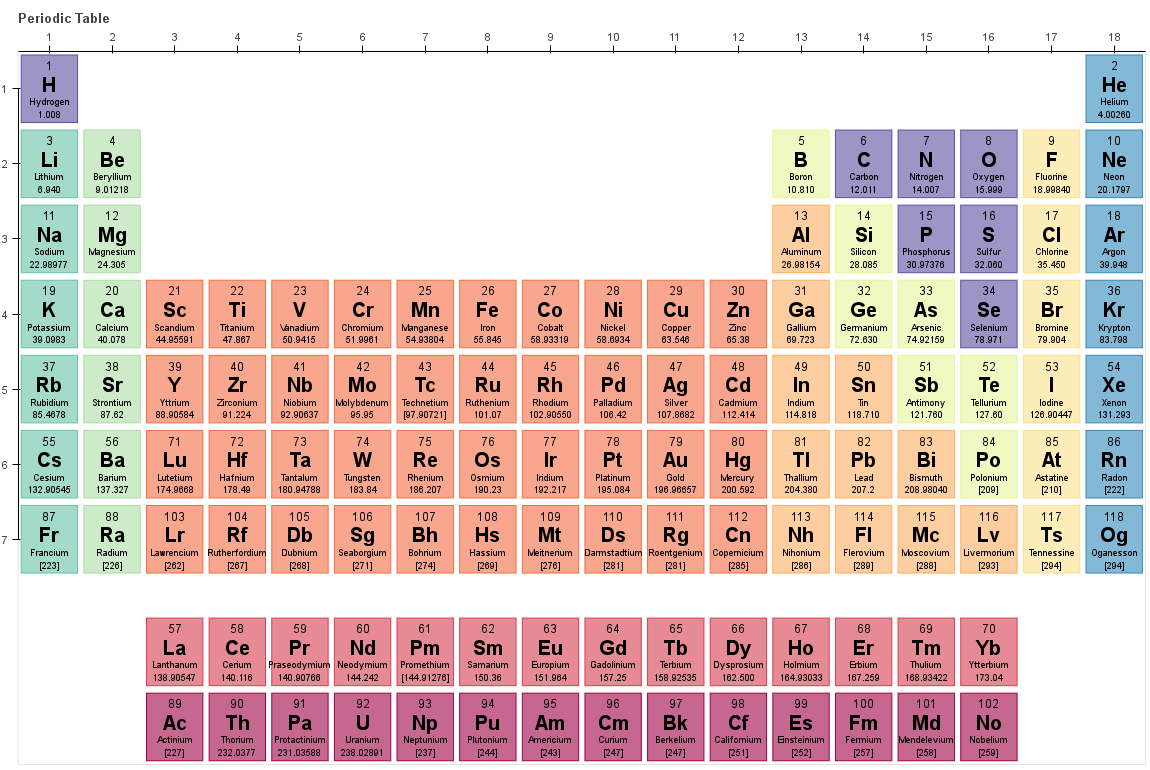
The main page allows creating custom made periodic tables with a variety of properties displayed next to the standard symbol, name and atomic number. The Property can be chosen from the drop down list and will be displayed in the bottom part of each rectangle that represents an element. Moreover some basic properties will be displayed by the HoverTool when you hover over the element.
The second list named Color by contains a list of common categories that elements can belong to, such as: block, period, series and so on. Selecting one of those categories will apply the appropriate color mapping to the elements. In the example below the elements have distinct colors for different series.
The last entry from the Color by list is Property which applies a color map (based on the palette selected from the third list Palettes) to the selected property resulting in a heat map - type plot. The example below shows such a heat map applied to the values of covalent radius (Pyykko) where the Inferno palette was selected. The largest values are the brightest - yellowish color for Cs and Fr and the smallest values are the darkest - see H and He.
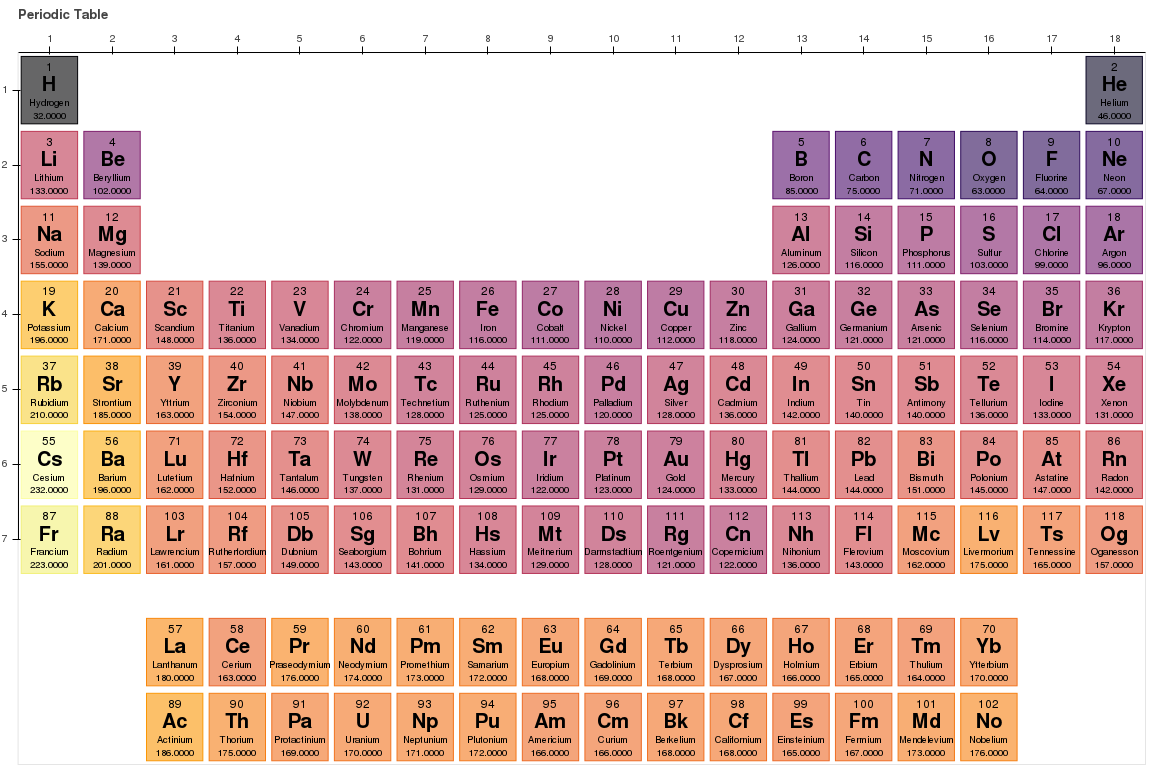
If you would like to save a png file with a particular view of the periodic table you can use the bokeh save tool in the upper right corner of the plot.
Correlations
Another useful feature of the app can be found under the correlations tab, where you can produce scatter plots and explore the relations between various properties of the elements.
The main motivation for this part of the app came from the observation that there are many variations of the periodic tables on the web, however most of them are focused on exposing information about individual elements rather that uncovering the interdependencies, regularities and laws relating different elements.
To update the plot select what should be on the X Axis and the Y Axis from the lists and additionally choose what category should be used to color map the points. Below is an example in which the covalent radius (by Pyykko) is plotted against the atomic number with series as the categorical variable to guide the colors.
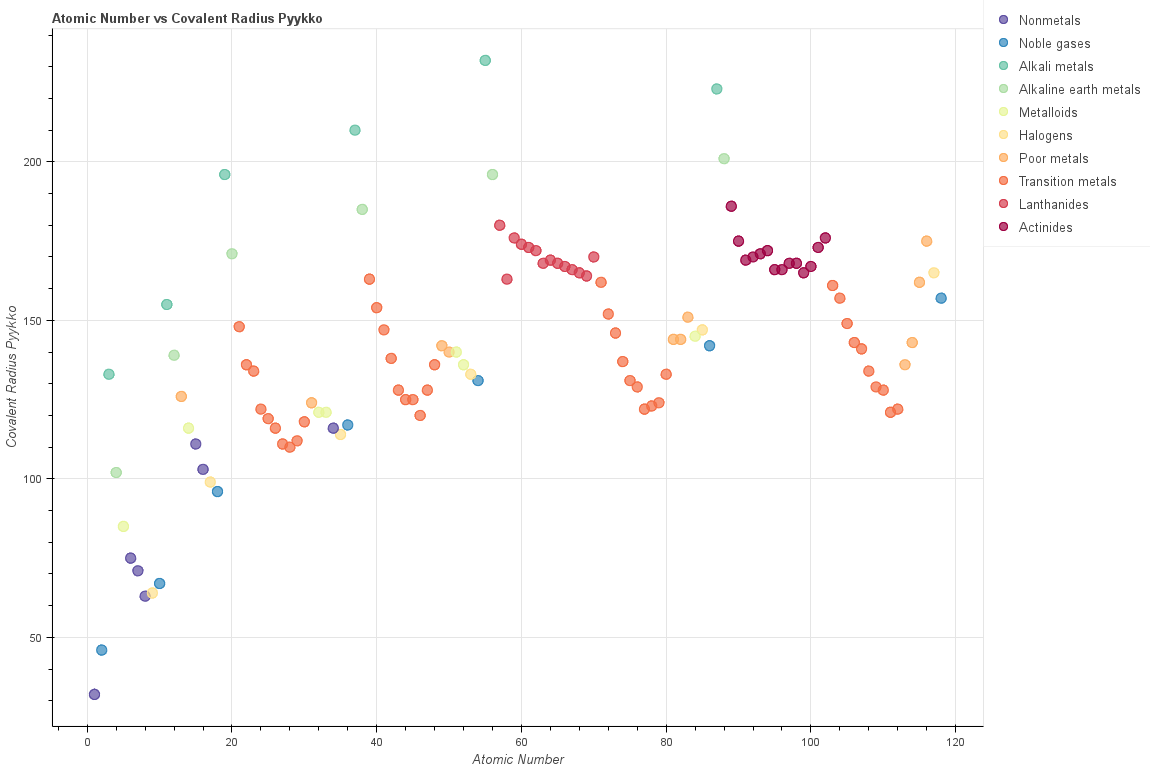
If you go to the actual application you can interact with the plot even further by using the bokeh toolbar located in the upper right corner. You can pan the plot, zoom on a particular area, resize the plot and save a resulting png image. Moreover if you put your mouse cursor over any point the HoverTool will give you additional information about the element the point corresponds to.
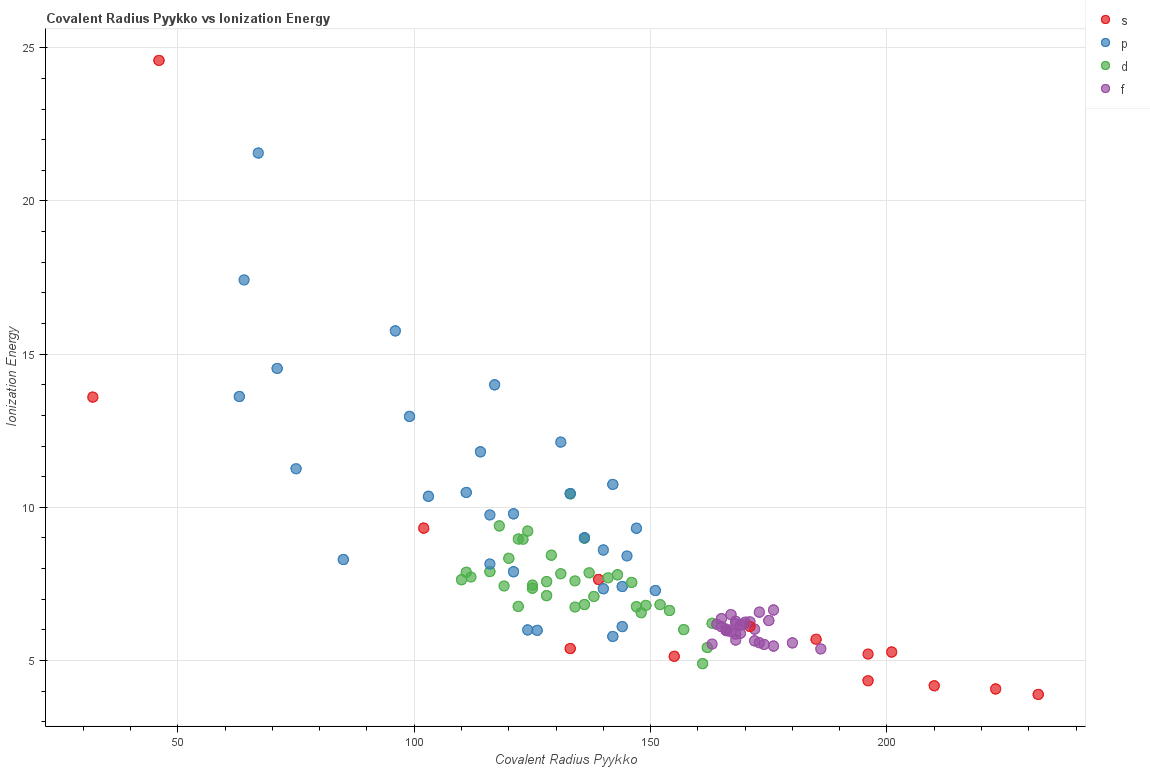
Another example below illustrates how ionization energy changes with covalent radius (by Pyykko) categorized by the block:
Get Involved
The app uses flask as the framework binding all the parts together and internally pandas as the source of the data structures. If you are interested where the raw data comes from check out the data documentation of mendeleev where you can find all the details.
If you have any suggestions about the app or you found a bug you can let me know by creating a github issue or simply leave a comment below.
If you would like to help by contributing some code or documentation, that's great. I'm open to collaborations so do not hesitate to fork the project and create a pull request with your new feature or a bugfix.